[ad_1]
Dilok Klaisataporn/iStock via Getty Images
This article will serve as the ultimate guide and complete overview of Hims & Hers Health (NYSE:HIMS) and why I believe this will be one of the top performing stocks in 2023.
Thesis
Hims is a dramatically undervalued stock, which I expect to produce double digit returns into the foreseeable future. Investors should be buying with both hands, but instead are throwing in the towel. My base case forecast is $17 per share, which represents 175% upside from the current stock price of $6.40 per share.
Business Overview
Hims is a telehealth company which connects patients to licensed physicians for a range of medical issues, such as: sexual health, mental health, hair loss, and dermatology. The company fulfills its prescriptions by connecting patients with licensed pharmacies after a physician has made a diagnosis. Hims has a popular app for iOS and Android, became public in 2021 via SPAC, and operates in all 50 states.
Additional commentary: Hims is an innovative company which is shifting the landscape of how patients access healthcare and interact with physicians. The healthcare sector needed to be brought into the 21st century; Hims is paving that road. By modernizing the healthcare sector using technology, Hims could be one of the revolutionary companies of the future.
Problem that Hims Solves:
Patients need easier and less expensive access to healthcare. Hims solves both by providing patients easy access to physicians and low cost prescriptions all from the comfort of their home. Hims’ platform ticks off all the important boxes in order to revolutionize healthcare: ease of use, accessibility, low cost, convenience, value driven content, and most importantly, providing solutions which work.
Competitive Advantage
Hims has six major competitive advantages over other telehealth pure plays:
- Hims has the fattest margins.
- Hims has the best brand recognition and largest following on social media.
- Hims sells proprietary formulas and has presence in tens of thousands of retail store fronts.
- Hims’ customers have a higher willingness to pay as they perceive it as a “premium brand.”
- Hims provides a seamless experience with vertical integration (the latter being still developed).
Additional commentary: Hims has an efficient cost structure for a new business. Its gross margins are nearly 80% in an industry where competitors are lucky to achieve half of that number. This puts Hims in a position of power and enables it to be the lowest cost provider, if needed.
Its brand recognition and large social media following will continue to bring in new customers as its target audience, Millennials and Gen Z, comprise a huge percentage of total social media users. The proprietary formulas and presence in retail store fronts share the goal of making Hims a household name. The “Apple-esque” marketing campaign solidifies Hims as a premium brand in the eyes of customers and thus, increases their willingness to pay.
Lastly, the overall user experience far surpasses anything competition has to offer. The Hims and Hers apps are beautifully designed, provide educational content, easy to schedule medical consultations, a 24/7 concierge service, a wide-breadth of products that pair well with one another, and one click shopping. The Hims app has 6.7k reviews, a 4.8 star rating, and is #31 in the iOS app store.
Total Addressable Market (TAM)
The total addressable market in the telehealth space is large. Here are some estimates based on Hims’ four main category of products:
- Hair Loss: $3 billion
- Sexual Wellness: $4 billion
- Mental Health: $14 billion
- Dermatology: $44 billion
Total: $65 billion
Additional commentary: Hims expects to earn $519 million dollars in 2022, which reveals the company has captured less than 0.8% of the market. If the company continues executing and captures 8% of the market, then it will generate $5.2 billion in annual revenue.
These categories have many catalysts for growth, which I have written about in great depth in this article. The key takeaway is none of these issues are expected to decrease; for example, the incidences of balding, erectile dysfunction, mental illness, and skin issues are expected to either remain the same or increase.
Note: As the company expands its product offerings, its available markets will increase. Therefore, the company’s future TAM is dynamic and not solely limited to the aforementioned.
Current State of the Business
Hims made a new 52-week high of $7.45 on December 13th, 2022. To put this in perspective, the Nasdaq is down over 33%, the S&P is down 21%, and the Dow is down 11%. In a bear market where growth stocks are getting crushed, Hims is in a silent bull market; which by the way, is how bull markets typically start until ultimately, everyone else takes notice. Below are current performance highlights:
Medical Consultations
Medical Consultation Numbers (Hims Q3 2022 Investor Presentation)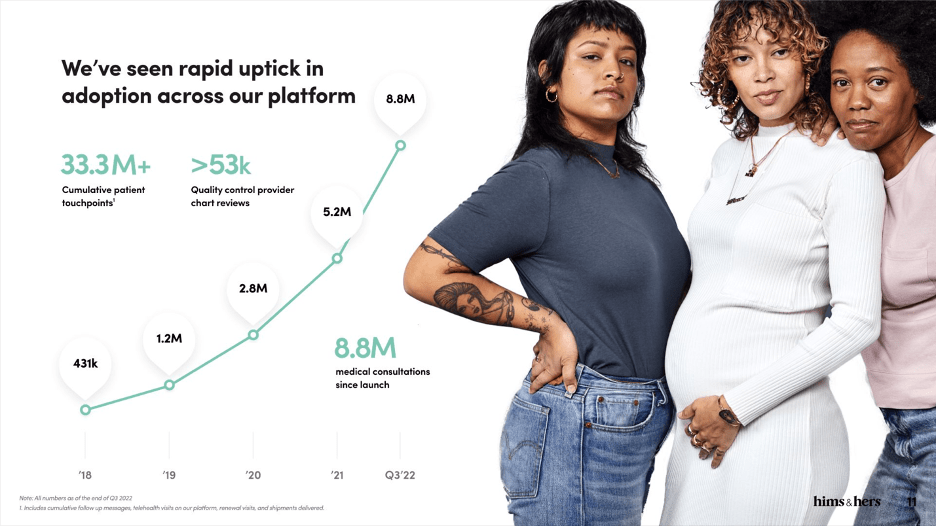
The starting point for the company’s success is its medical consultations, which are currently 20x higher than in 2018. Management has delivered exponential growth in this category by spending a small fortune on marketing in order to increase its brand awareness to the level of a ‘household’ name.
Subscription and Revenue
Subscription and Revenue Growth (Hims Q3 2022 Investor Presentation)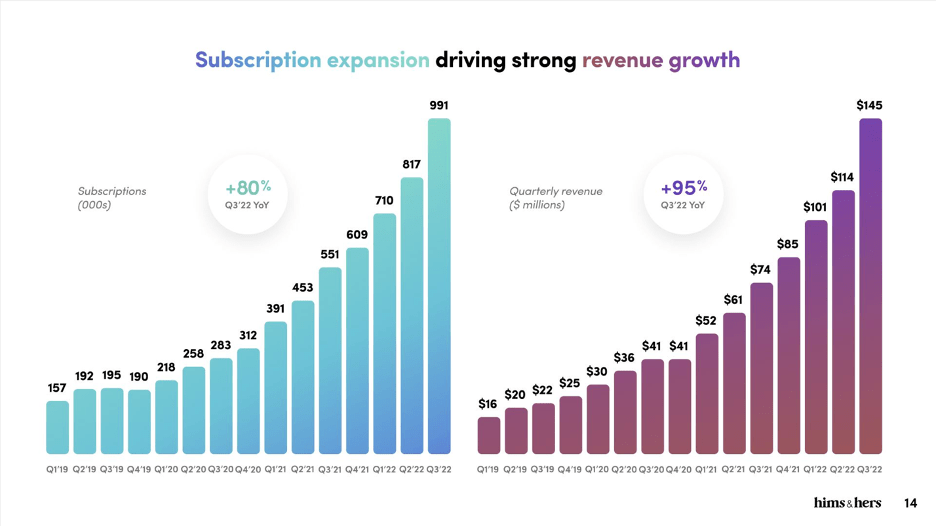
Medical consultations lead to subscription and revenue growth. From both charts, we can see exponential growth in both categories. Subscriptions are currently 6x higher and revenue is currently 9x higher compared to Q1 2019. It is important to note this was achieved primarily without the addition of the company’s mobile app, which was introduced in 2022. The app is going to be the driving force behind subscription and revenue growth as it expands access to millions of additional customers and makes purchasing extremely easy with ‘one click’ shopping.
Note: FY 2022 revenue is expected to be $519 million compared to $27 million in FY 2018. Therefore, revenue is actually expected to be almost 20x higher than only four years ago.
Repeat Customer Revenue
New vs. Repeat Customer Revenue (Hims Q3 2022 Investor Presentation)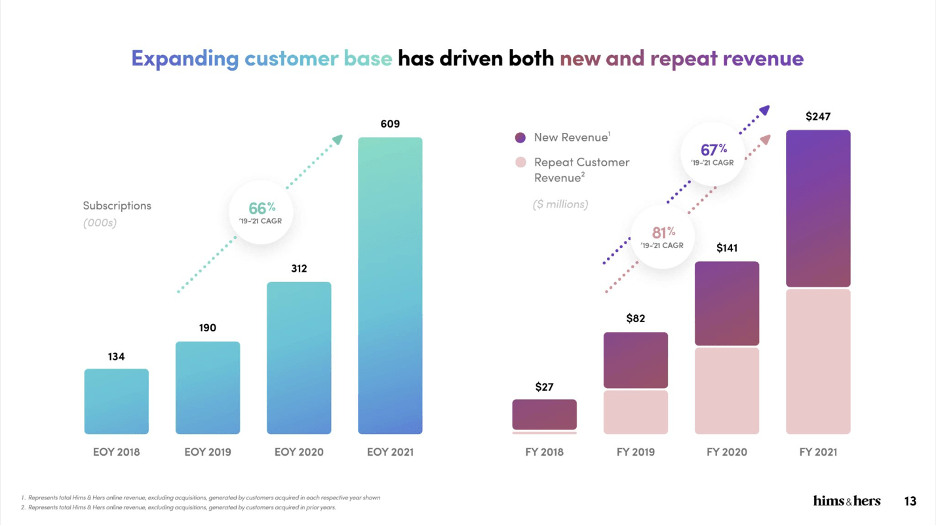
Here is the breakdown of new versus repeat customer revenue; the latter being crucial to long-term success in a subscription-based business model as profitability is based on continual purchasing. From the chart on the right, we can see that repeat customer revenue growth has outpaced new customer revenue growth by 14%. I am ignoring 2018 because that was the first year of operation so almost all purchases were new customers.
Note: Currently, the company has a high marketing spend in order to earn subscription-based revenue. If Hims solely relied on new customer purchases, its marketing spend per customer would outpace its revenue per customer leading to a never-ending cycle of borrowing money or selling stock to subsidize losses and continue operations. At the moment, the company is doing well at maintaining customers with retention rates north of 85% and multi-month subscriptions on the rise (2022 has seen sequential improvement over the 2021 rate of 36%). The average order volume is increasing as well. The app helps retain customers and increase their ticket as it provides significant value to their lives.
Common Arguments and Explanations
Hims’ has been a widow maker stock for many investors as the stock price at one point declined from $25.40 per share to $2.72 per share. It seems the market has deeper concerns about the company’s prospects. I will provide commentary on some common arguments:
The company has no moat.
Investors who claim the company has no moat without discussing the company’s value proposition are “putting the cart before the horse.” The moat is the after result of having a strong value proposition.
Investors used to claim Netflix (NFLX) had no moat as anyone could start a business shipping movies. What made Netflix special was its value proposition – it provided a service and product better than its competitors with its ease of use, convenience, and no late fee policy. This value proposition ultimately created the company’s moat.
Hims’ value proposition is that it provides a 24/7 service, creates custom formularies, and most importantly, allows patients to access traditional healthcare on a modern platform. Over time, the company’s value proposition will create a recognizable moat. If another company wants to compete on market share, it will have to top Hims’ value proposition, not cross its moat.
The company is at the mercy of larger players with more established infrastructure.
This is a legitimate risk as larger players such as Amazon (AMZN) and CVS (CVS) could leverage their larger infrastructure and disrupt Hims’ profitability. Investors have to let this develop and draw conclusions after more events materialize.
The company has no path to profitability.
Investors who claim Hims cannot be profitable have not examined the financial statements closely enough. If we deduct marketing expenses, the company would already be profitable. Management has strategically decided to forfeit profitability today in order to spend more on marketing with the purpose of gaining as many customers as fast as possible. Focusing on growth at this stage rather than profitability is the right call.
Note: Management has guided that in Q4 2022, EBIT will be positive for the first time in company history. The progress towards profitability is well on its way.
Retail expansion will shrink gross margins.
As the company expands into more retail stores, some investors are worried margins will shrink. However, in Q3 2022, gross margins actually expanded 200 basis points quarter over quarter to 79%, in line with past performance.
The company is susceptible to government regulation.
This is a legitimate threat as government regulation always over looms in the healthcare sector. It is too early to foresee any specific developments so investors must take a wait and see approach.
Investors fear macroenvironmental factors
There are always headwinds to a company’s success, such as inflation, interest rates, unemployment, etc. Drown out the noise and focus on the fundamentals. Do not let sensationalism frighten or inspire you into making decisions. If the company is doing well, its stock should do well.
Future Predictions for the Business
In the following sections, I will provide DCF Valuations and an EPS Valuation to arrive at a fair value share price. In a DCF, we forecast free cash flow to estimate the value of a business. In EPS, we estimate net income and attach a market price multiple to it.
DCF Valuations: Base, Bear, Bull
Here are three DCF valuations for the major possible outcomes in share price.
Base Case
Base Case DCF (DocShah Capital)
Let’s start with taking a look at my base case forecast, which in my opinion is the most realistic and therefore, most likely outcome. We will go through each assumption:
Sales Growth
I have sales doubling this year and subsequently decreasing to 5% in ten years. Many readers disagreed when I made this forecast at the start of the year, stating there is no way revenue could double. I strongly disagreed. My counterpoint was the company has not left the introductory stage of its business lifecycle nor come close to peak saturation of the market. The most sales growth occurs during the growth phase. Given that the company was growing at 80% per year prior to 2022, it made sense that 2022 revenue should be higher. The second reason was that Hims launched its mobile app in 2022, which I expected to be a huge catalyst to sales.
In fact, here is an excerpt from my last article which serves as proof of my accurate forecast in the face of Wall Street. Here is a table showcasing the different forecasts made by Hims, Wall Street analysts, and myself:
Hims 2022 Revenue Forecasts (DocShah Capital)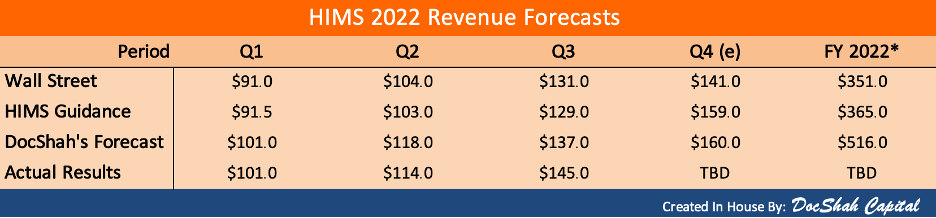
Wall Street’s and Hims’ quarterly forecasts were their forward guidance from the previous quarter. My quarterly forecasts were placed at the start of the year without ever needing to be updated. As of today, management guides for FY 2022 revenue of $519 million versus their guidance of $365 million at the start of the year. I guided for $516 at the start of the year. I hit the mark perfectly.
*The FY expectations by all three parties is what we each expected the company to earn at the beginning of the year. Wall Street underestimated the firm while I believe Hims’ management sandbagged guidance.
Further proof: Here is my exact excerpt from my article early on in the year:
My Previous Revenue Forecasts (DocShah Capital)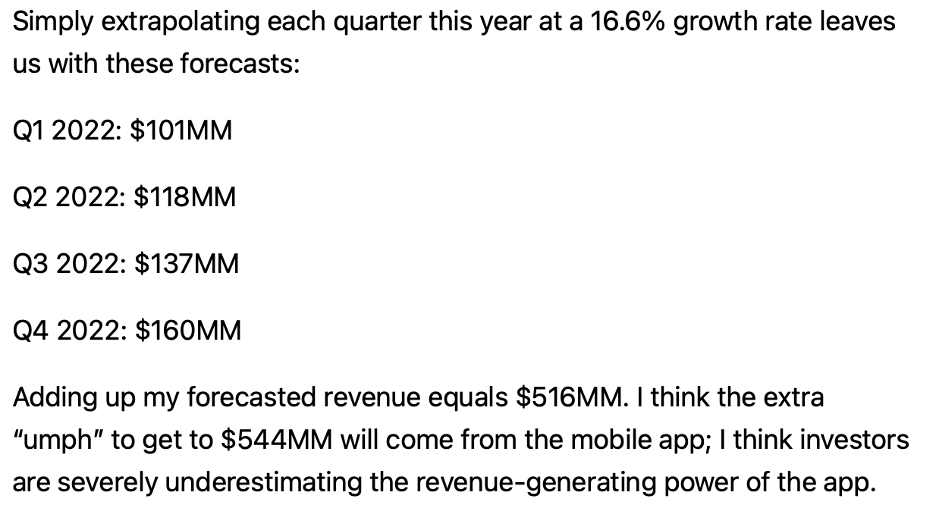
COGS
I have taken the company’s guidance and slowly lowered margins from 73% to 70% over time.
SGA
I considered current performance, what I expect operating margins to be in the future, and then worked backwards in order to calculate SGA expense. Essentially, for next year, I assumed (44%) operating margins gradually working towards 17% in ten years.
Tax Rate, Net CA, CAPX
I kept the tax rate the same and slowly flipped net current assets from negative to positive. I rapidly increased the company’s capital expenditures to support its growing revenue. After six years, I decrease the rate of capital expenditure growth to 5% as less investment is needed to support slower revenue growth.
WACC
The weighted average cost of capital is 11.22% and was calculated using the CAPM model. The assumed beta was 1.25.
Note: Yahoo Finance and Zachs state Hims has a beta of 1, but growth stocks tend to be more volatile than the overall market. As such, I increased the beta by 25% to account for the additional volatility.
Terminal Value
The terminal value is set to 2% to be conservative.
The Bigger Picture
In forecasting future cash flows, it is easy to lose the forest for the trees. We can become so granular that we forget to see if the bigger picture even makes sense. We can check this by comparing year ten to year one.
Revenue
Revenue in year ten is $5.3 billion verse $516 million in year one. Considering Hims is still in its infancy, in a rapidly growing industry, and has already 10x-ed its sales in its first four years, this forecast “makes sense.”
Profitability
Based on my assumptions, both NOPAT and FCF will be positive for the first time in 2024 and 2025. This forecast “makes sense” as management has guided they expect the company to be EBIT positive for Q4 2022. This is the first step in generating a net operating profit after tax and then becoming FCF positive.
Fair Share Price – Base Case
My base case is the stock is worth about $17 per share, which represents a 175% upside from the current stock price of $6.40 per share.
Bear Case
Bear Case DCF (DocShah Capital)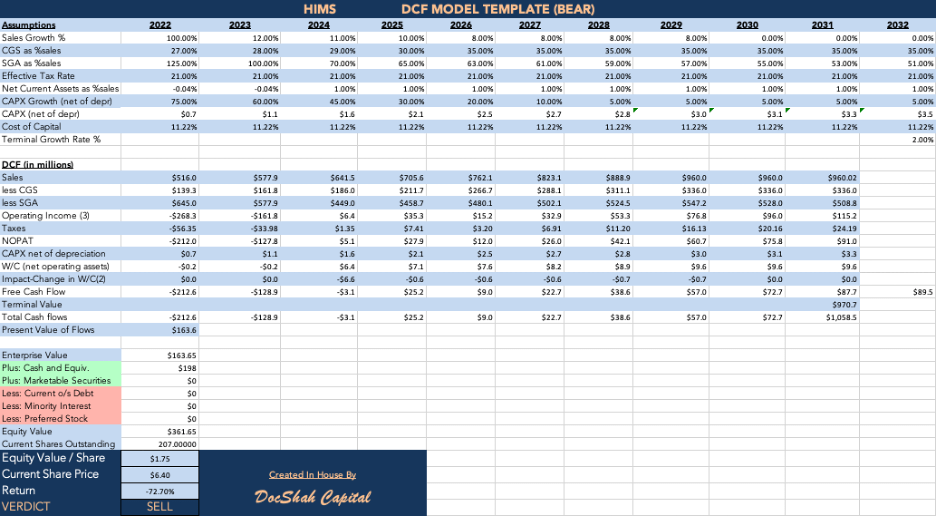
In the bear case, let’s forecast the company only musters 12% growth next year and continually struggles, ultimately hitting 0% growth. Next, we will forecast gross margins fall from 73% to 65%. Lastly, SGA expenses remain high and are not leveraged with the increase in revenue.
If we zoom out, the company will only be about twice as big in ten years, more or less breaking even in NOPAT in 2024, and FCF positive in 2025.
Fair Share Price – Bear Case
Assuming no share dilution, my bear case is the stock will trade hands around $1.75 per share, which represents a 73% decline from $6.40 per share.
Extreme Bear Case: Hims never produces a profit and its share price hits $0 per share.
Bull Case
Bull Case DCF (DocShah Capital)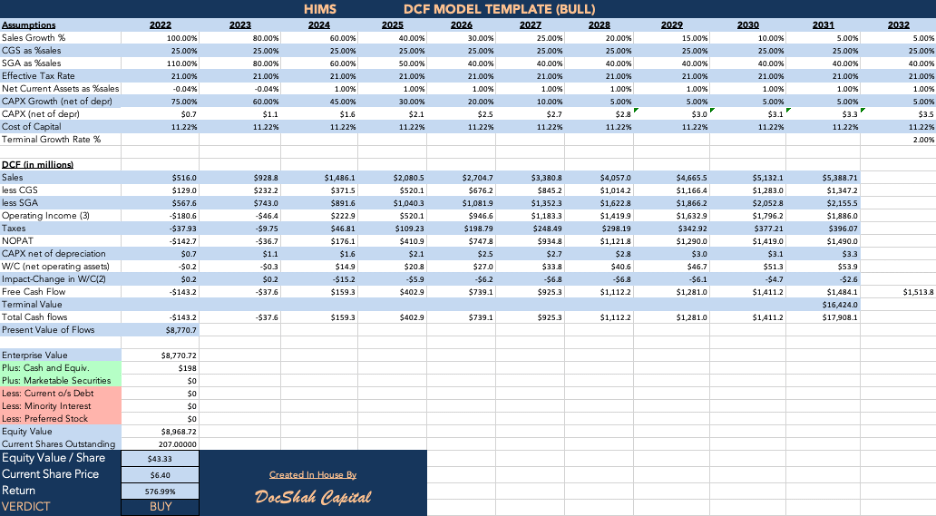
In the bull case, let’s assume that revenue growth remains the same as in the base case. However, as the company has grown, it used leverage, scale, and efficiency to dramatically lower its costs. This scenario results in more revenue sliding to the bottom line.
Let’s forecast that gross margins stick at 75% and that SGA expenses trend strongly downward over time from 110% to 40% of revenue in year ten. Stepping back, this implies that the operating margin in year one would be (35%) compared to 35% in year ten. To give investors some perspective, the company’s operating margin in 2021 was (40%), so we are basically picking up in 2022 where Hims left off in 2021.
If we zoom out, we can see that the company is 10x bigger in year ten verse year one and becomes NOPAT and FCF positive in 2024.
Fair Share Price – Bull Case
My bull case is the stock will trade hands at about $43 per share, which represents a 577% upside from $6.40 per share.
Extreme Bull Case: Hims performs as above or better, but the market takes it to higher multiples. In that event, the stock could increase 10-times or more.
EPS Valuations
In EPS valuation, we analyze net income as opposed to free cash flow, and attach a market price multiple to EPS. The table below is separated into a bear and bull case (the base case is the same as the bull case as the revenues are identical).
EPS Table (DocShah Capital)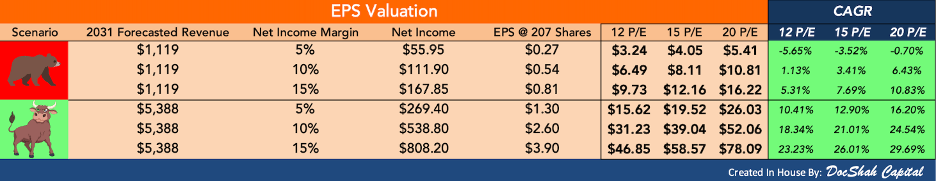
We start with revenue and calculate net income by applying three realistic net income margins: 5%, 10%, and 15%. Once we have net income, we can calculate EPS, and then attach a market price multiple (P/E ratio) to arrive at the corresponding stock price.
Investors tend to peg healthcare stocks to a 12 P/E, so I used that as my starting point. In addition, I included a 15 P/E and a 20 P/E as those are two multiples which might reflect the market’s expectations for rapid growth. Lastly, I included a CAGR table to make it easy for investors who are comparing Hims to other potential investments.
One of my goals for this article was to provide readers the ability to make their own forecasts. This table provides a quick and accurate way to value Hims no matter the reader’s level of financial literacy. You simply identify if you are a bear/bull/in between, pick a net income margin you feel is realistic, pick which P/E multiple you expect the market to assign to the stock, and voila… you have arrived at your very own forecast of the company’s future stock price based on fundamentals.
Fair Share Price
My conservative expectation (based on industry norms) is Hims could initially have a 5% net income margin. If we apply a 12 P/E ratio to the stock, then the fair share price will be about $16 per share. This prediction corroborates my ‘base case’ DCF and offers investors a return close to 11% per year.
The Lynch Calculation
The Lynch Calculation (DocShah Capital)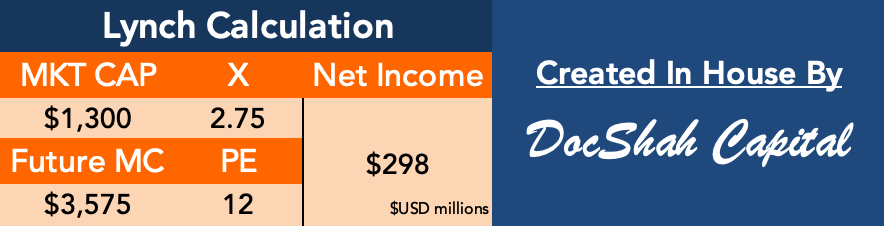
Peter Lynch used this “thumbnail” calculation to quickly validate or refute a valuation. It is pretty simple:
- We take the current market capitalization of a company and multiply it by how many times we think its stock will go up (in this case 2.75x or 175%). This gives us the future market capitalization of the stock.
- Then, we divide that by the fair value P/E for the sector (in this case twelve). The result is the net income the company would have to earn to justify a 2.5x increase in its market capitalization.
In other words, if Hims earns $298 million in net income, we can expect the current market capitalization of $1.3 billion to increase to $3.575 billion. This thumbnail calculation corresponds well with the results in our EPS table. For example, in that table, the cell which has $269 million in net income results in a $15.62 stock price using a P/E of 12. Adjusting the numbers to account for the extra net income, we can assume the stock price would be around $17 per share. This also represents a 2.75x increase from the current $6.40 stock price.
Technical Analysis
HIMS – Technicals (1Y) (Trading View)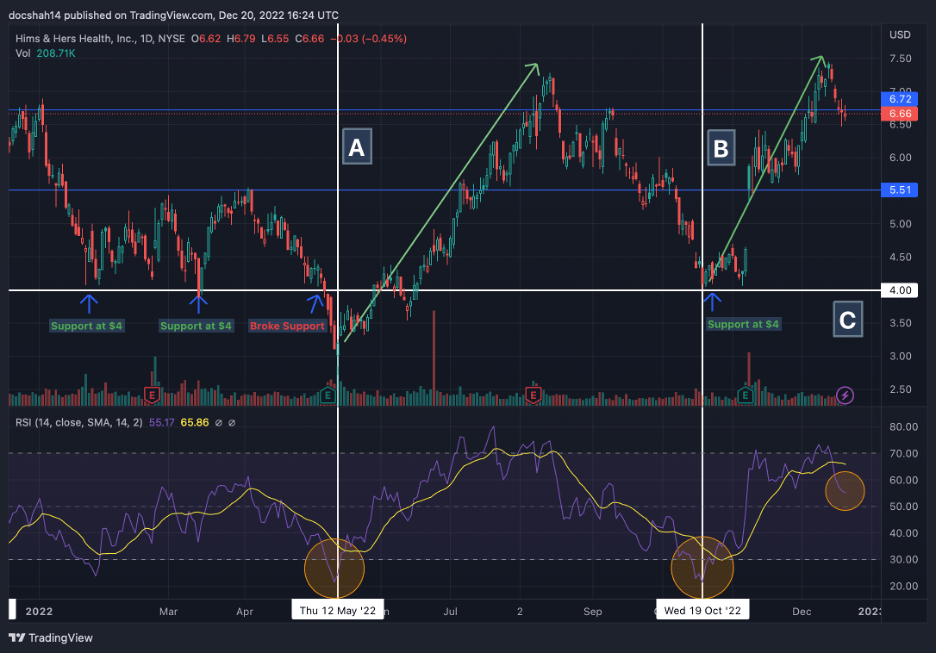
Technicals can provide interesting data in support or refutation to an investment thesis, but cannot substitute nor replicate fundamental analysis. Individuals who form a thesis solely based on technical analysis are speculators, not investors. However, the benefit in technical analysis lies in the various data that help us base short-term expectations on price action. Let’s go step by step.
Vertical Lines A and B
These lines are times when the stock price bottomed. You will notice that when the price hit its lowest, the RSI dropped under 30, indicating the stock was oversold. Following the bottom, the stock had massive runs to the upside, highlighted by the green arrows (130% and 82%, respectively). This relationship serves as data to be used as future reference if we see a repeat in this scenario (stock bottom, RSI under 30).
Horizontal Line C
This line showcases the stock’s support level over the past year. There are four notable points where the stock price hit $4 per share. The first two and last resulted in a bounce off support and the third resulted in a breach of support. I believe the breach was an anomaly and if the stock begins to retreat, investors can take solace in knowing $4 per share has historically provided solid support.
Current RSI
Lastly, I want to point out the current RSI of 54, which is highlighted by the yellow circle under point C. Prior to this level, the RSI exceeded 80, which indicated the stock was overbought and a “blow off top” could occur. Consequently, I would not be surprised if the price fell before beginning another leg up.
Ratio and Competitor Comparison
Hims Competitor Comparison (DocShah Capital)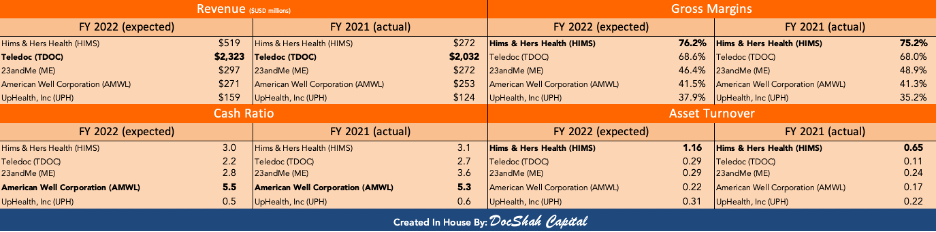
Looking at a company’s performance in isolation can be misleading, thus, we must compare Hims to competitors to see relative strength and weakness. There are four areas I want to analyze, each casting light on the business from a different angle.
Revenue
Revenue measures consumer demand for a company’s products and/or services. While Hims’ revenue came in second, its YoY growth was much higher than any competitor. Due to Hims’ competitive advantages, I believe its revenue will surpass Teledoc’s within the next decade.
Gross Margins
This margin ratio measures profitability and is defined as gross profit as a percentage of revenue. Hims has the fattest gross margins and I expect this to remain true in short-term due to management’s historical performance.
Cash Ratio
This solvency ratio measures liquidity and is defined as cash as a percentage of current liabilities. Hims has the second-best cash ratio and is not burning cash at a fast rate, therefore its cash ratio should remain strong in the short-term.
Asset Turnover Ratio
This asset efficiency ratio measures productivity and is defined as revenue as a percentage of average assets. In other words, it measures how well a company generates revenue off its asset base – the higher the better. Hims leads all competitors by far and I expect this to continue as the company leverages its growing asset base and makes progress on vertical integration.
Note: There are other competitors, such as Amazon and CVS but they are not telehealth pure plays and would not serve as valuable comparisons. Secondly, other telehealth pure plays exist, but most are privately owned or traded on the OTC market.
Fast Facts
Here are some supplementary bullish indicators for Hims.
Inside Ownership
Ownership Breakdown (Seeking Alpha)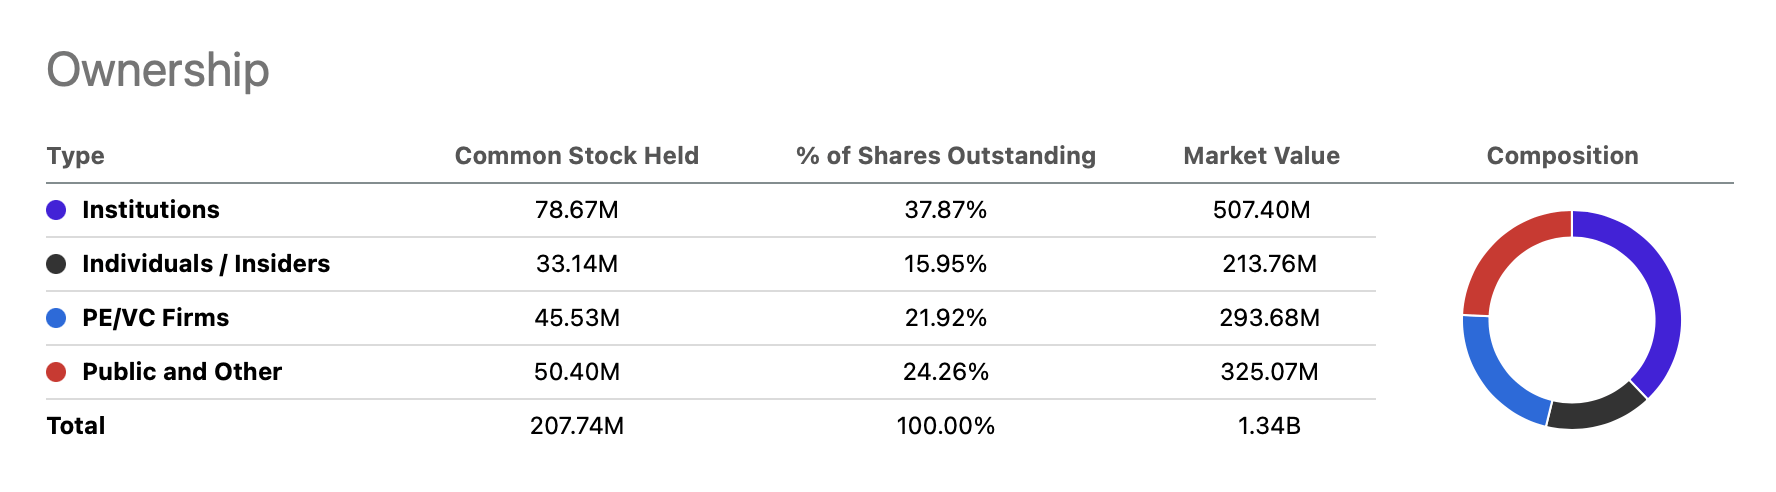
Executives sell stock for a myriad of reasons. Executives usually only buy stock for one: they think the price is going up. Collectively, Hims’ insiders own 16% of outstanding shares, which is a substantial ownership claim and a good sign. In addition, there are two recent major insider buys, which I want to draw attention towards:
- CEO, Andrew Dudum bought $480K worth of shares on 12/13/21 at a weighted average price of $5.93 per share.
- Board Member, David Wells bought $3 million worth of shares on 8/30/21 at a weighted average price of $8.23 per share.
Institutional Ownership
Hims Institutional Ownership (Fintel)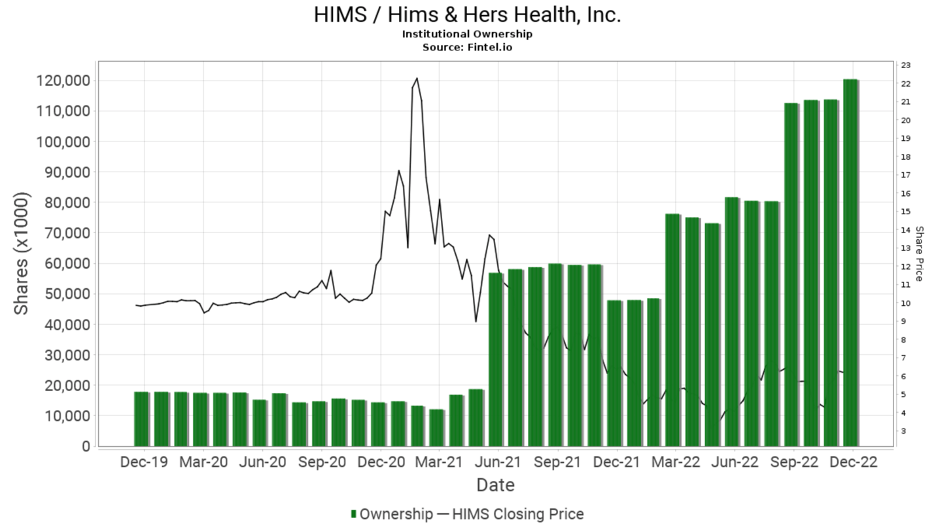
There is a striking dichotomy present: institutional ownership has gone up while the price of the stock has gone down. Institutions have been buying shares of Hims with both hands, while weaker hands of retail have been shaken out of the market. Today, institutions own 7x as many shares as they did only three years ago. As Hims continues executing, I think institutions will continue buying, leaving retailers who rushed for the exit sign with two choices: (1) sit on the sideline or (2) buy at a much higher price.
Market Cap and Cash Position
The company’s market cap is $1.3 billion. For that price, investors are buying a business which is:
- Expected to earn $519 million in revenue in 2022
- Growing at 95% YoY with 79% gross margins
- Has $200 million in cash and no debt
- Positioned as the market leader in an exploding industry
Those who read my work know I am not a fan of the P/S ratio, but when extreme, it does highlight discrepancies and potential value plays. Investors are able to buy Hims at a P/S of 2.5, which is a good deal considering all that you are getting for that price.
In fact, with each share purchased, investors are effectively getting a $1 back ($200MM net cash/207 million shares). Therefore, every share purchased today is actually being sold at $5.40, instead of $6.40, which represents a 16% discount in my view.
Risks
We discussed some risks in the section, ‘Common Arguments and Explanations,’ but I will provide a more comprehensive list below. Please note, this is not a complete set of risks.
- Larger, more established players drive Hims out of business.
- An increase in government regulation disrupts business operations.
- Retail expansion decreases profitability.
- Macroeconomic factors delay or prevent profitability.
- Telehealth is susceptible to a lack of product differentiation, which could cause a price war.
- Low barriers to entry might cause more competition, decreasing market share and profit.
- Share dilution causes the fair value of the stock to substantially decline.
- For the company’s set of risks, please click here.
Takeaway
I believe Hims & Hers Health is a once in a lifetime stock. The healthcare sector has been one of the last to be disrupted by technology and Hims is driving that change. The company’s competitive advantages, total addressable market, and brand awareness make it a prime candidate to be a powerful growth stock. Hims’ medical consultations, revenue, and portfolio of products have been rapidly expanding, to put it lightly. If management fulfills its duties and transfers that progress to the bottom line, investors will be rewarded handsomely.
I believe my ‘base case’ DCF valuation to be the most likely outcome; the stock should be worth about $17 per share, which offers a 175% return. There are numerous risks involved in buying an unprofitable company that is susceptible to significant competition and government regulation, especially in a bear market. However, investors who have a long-term time horizon (10+ years at the least) should consider and evaluate this stock. If management executes as promised, investors will be glad they formed a position in the early stages of this company.
Editor’s Note: This article was submitted as part of Seeking Alpha’s Top 2023 Pick competition, which runs through December 25. This competition is open to all users and contributors; click here to find out more and submit your article today!
[ad_2]
Source link